01
See the whole plant
Every building, line, panel and utility, each with its live reading.


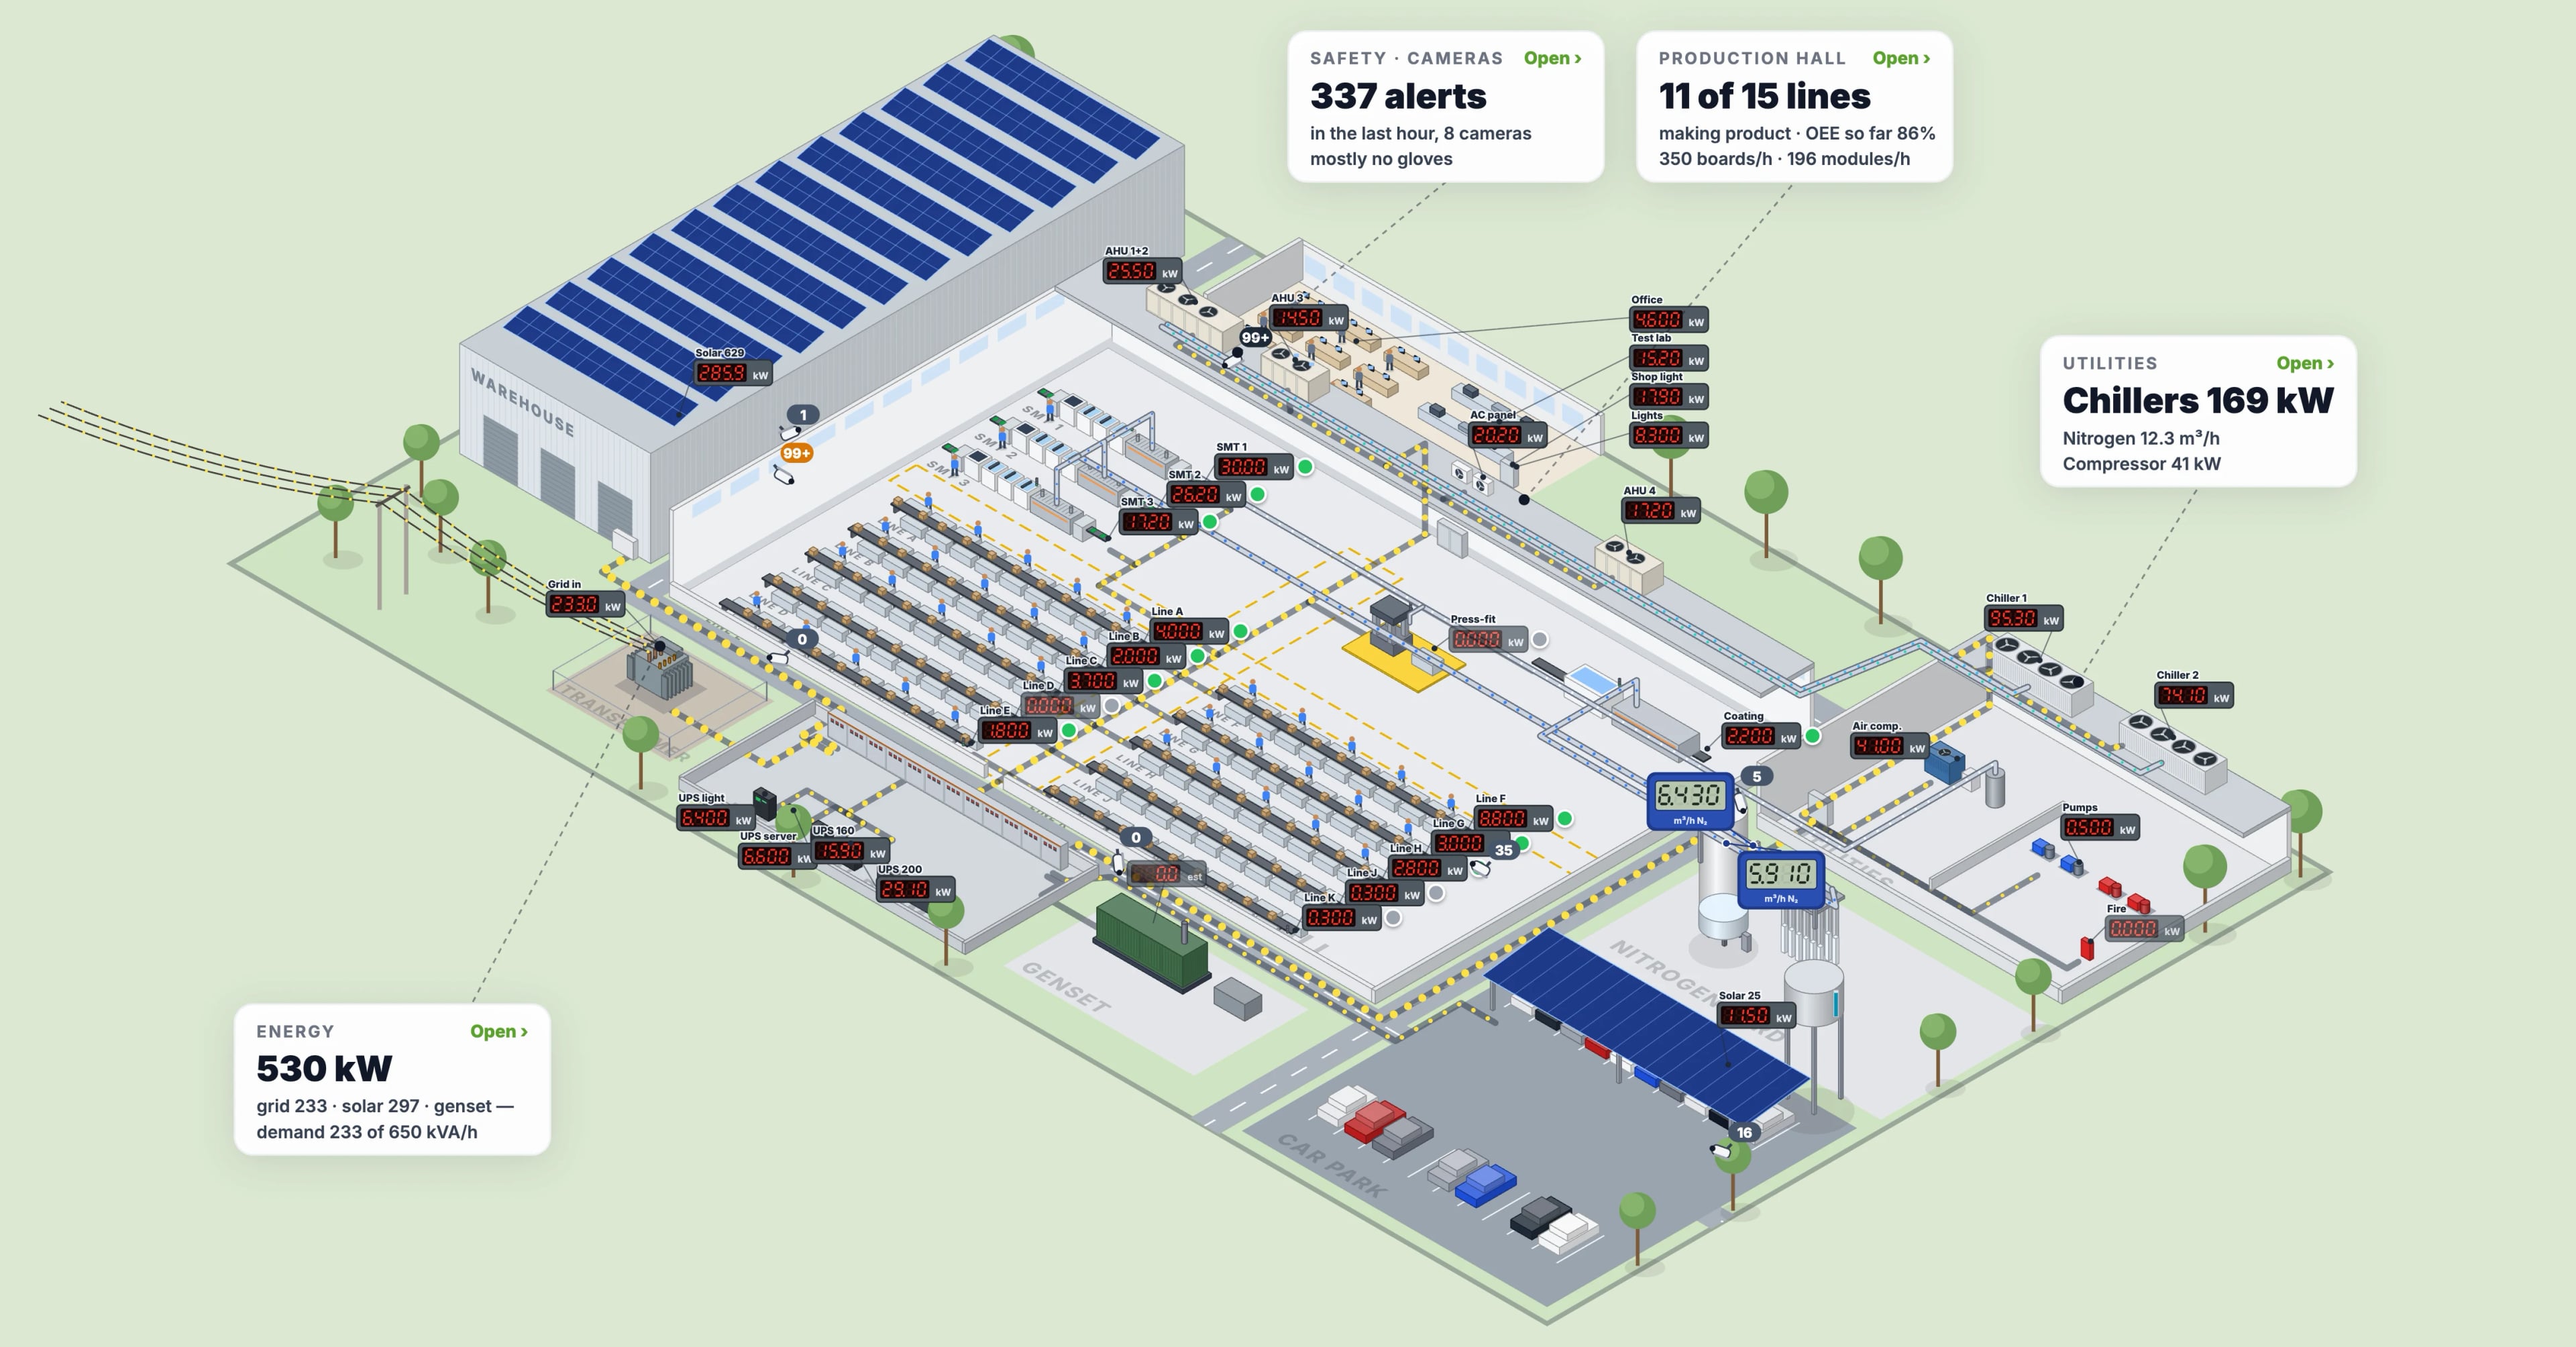
Every machine and meter where it really stands, with its live reading. Try a change on the copy first, like a new machine or a power cut, and see how the plant reacts.
Every building, line, panel and utility, each with its live reading.
Go from the site to a hall, then into a line and its machines.
Each meter is drawn as it looks on the panel, with its live numbers.
Energy, production, utilities and cameras. Click an alert to see where it happened.
Pick a date and watch it again: power cuts, peaks and stoppages.
Every camera on the map, with its view and its alerts.
Screens: sample data.
Turn off the grid, stop the compressor or add clouds, and see how the plant reacts. Your own twin can do the same for your plant.
This is a sample plant with simulated readings.
Tell us about your plant and we will show you how it would look.